| Notice | Directors Report | Management Discussion | Report on Corporate | Auditor’s Report |
| Balance Sheet | Profit and Loss | Schedules Annexed | Cash & Flow | Proxy Form |
SCHEDULES FORMING PART OF THE BALANCE SHEET
SCHEDULE 1 : SHARE CAPITAL |
31-3-2011 |
31-3-2010 |
Authorised : 60,00,000 Equity Shares of Rs. 10/- each. |
6,00,00,000 |
6,00,00,000 |
Issued : 45,76,000 Equity Shares of Rs. 10/- each. Subscribed and Paid-up : |
4,57,60,000
3,54,35,000 |
4,57,60,000
3,54,35,000 |
TOTAL : |
3,54,35,000 |
3,54,35,000 |
SCHEDULE 2 : RESERVES & SURPLUS
Capital Reserve : State Special Capital Incentive received Share Premium Account 2,03,55,000 |
31,00,000
1,52,20,250 65,26,010 |
27,00,000
1,52,20,250 57,97,184 |
TOTAL : |
2,48,46,260 |
2,37,17,434 |
SCHEDULE 3 : SECURED LOANS
From Banks: Cash Credit Account. [Secured by Hypothecation of Stock in Trade/ Book Debts] Term Loan from Bank of Baroda [Secured by Hypothecation of Plant & Machinery ] Car Loans from ICICI Bank Ltd [Secured by Hypothecation of Car] |
1,15,91,998 13,94,146 97,502 |
1,24,78,938 23,73,180 2,52,248 |
TOTAL : |
1,30,83,646 |
1,51,04,366 |
SCHEDULE 4: UN SECURED LOANS
Sales Tax Deferred (Interest free) |
1,53,82,815 |
1,60,47,839 |
(Payable within 1 year Rs.6,65,024/- Transferred to Current Liability) |
--------------- |
--------------- |
TOTAL : |
1,53,82,815 |
1,60,47,839 |
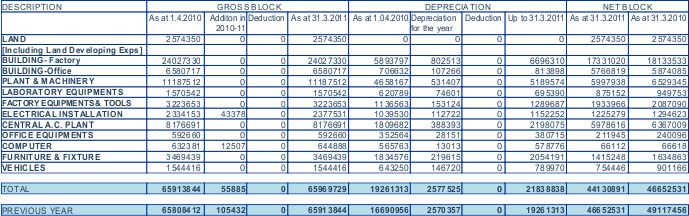
SCHEDULE 5 : FIXED ASSETS
SCHEDULE 6 : INVESTMENTS |
Face Value Rs. |
No. of Shares |
31-3-2011 |
31-3-2010 |
|
(a) Equity shares [fully paid, quoted] |
|||||
| 3i Infotech | 10 | 600 | 30,000 | 30,000 | |
| Akruti City Ltd | 10 | 12 | 6,480 | 6,480 | |
| Ansal Properties & Infrastructure Ltd. | 5 | 200 | 1,01,926 | 1,01,926 | |
| Arvind Mills | 10 | 500 | 60,681 | 60,681 | |
|
Bajaj Holdings & Investments Ltd. |
10 |
50 |
73,319 |
73,319 |
|
Bajaj Auto Ltd. |
10 |
100 |
28,678 |
28,678 |
|
Bajaj Finserv Ltd. |
5 |
50 |
27,770 |
27,770 |
|
Bank of Baroda |
10 |
500 |
1,18,534 |
1,18,534 |
|
Bank of Maharashtra |
10 |
300 |
6,900 |
6,900 |
|
Bell Ceramics |
10 |
333 |
21,880 |
21,880 |
|
Bharat Forge Ltd. |
2 |
30 |
3,804 |
3,804 |
|
Bharti Shipyard Ltd. |
10 |
200 |
64,841 |
64,841 |
|
Cairn India Ltd |
10 |
1015 |
1,62,400 |
1,62,400 |
|
CESC Ltd |
10 |
200 |
1,28,627 |
1,28,627 |
|
Coal India Ltd |
10 |
88 |
21,560 |
- |
|
Eveready Industries Ltd. |
5 |
500 |
17,645 |
17,645 |
|
GTL Infrastructure Ltd |
10 |
213 |
4,000 |
4,000 |
|
Gangotri Textiles Ltd |
5 |
1200 |
- |
70244 |
|
Gujarat Sidhee Cement Ltd |
10 |
1000 |
24,186 |
24,186 |
|
HFCL Ltd. |
1 |
500 |
12,192 |
12,192 |
|
HDFC Ltd. |
2 |
100 |
64,762 |
- |
|
HDIL |
10 |
100 |
14,505 |
- |
|
Hindustan Organic Chemicals Ltd |
10 |
1000 |
66,283 |
66,283 |
|
Hindustan Oil Exploration Co Ltd |
10 |
500 |
81,322 |
81,322 |
|
IDBI Ltd |
10 |
200 |
15,717 |
15,717 |
|
IDFC Ltd |
10 |
2000 |
1,64,446 |
1,64,446 |
|
Idea Cellular Ltd |
10 |
990 |
1,30,834 |
1,30,834 |
|
IRB Infrastructure ltd |
10 |
100 |
16,457 |
- |
|
Jagran Prakashan Ltd |
02 |
143 |
27,967 |
27,967 |
|
Kausalya Infrastructure Ltd |
10 |
176 |
10,560 |
10,560 |
|
Kingfisher Airlines |
10 |
200 |
10,641 |
- |
|
Lanco Infrastructure Ltd |
1 |
3210 |
77,040 |
77,040 |
|
Lumax Auto Technologies Ltd. |
10 |
372 |
- |
27900 |
|
Macleod Russels Ltd |
5 |
250 |
8,823 |
17,645 |
|
Mahindra Lifespace Developers |
10 |
200 |
1,84,668 |
1,84,668 |
|
Maars Software Ltd |
10 |
5000 |
57,340 |
57,340 |
|
Morepen Laboratories Ltd. |
2 |
500 |
7,455 |
7,455 |
|
NTPC Ltd |
10 |
500 |
71,801 |
71,801 |
|
Neyveli Lignite Ltd. |
10 |
400 |
22,868 |
22,868 |
|
Panama Petrochem Ltd |
10 |
250 |
32,369 |
64,739 |
|
Polaris Software Lab Ltd. |
5 |
200 |
32,299 |
32,299 |
|
Punj Lloyd Ltd |
2 |
500 |
99,416 |
99,416 |
|
Pyramid Saimira Theatre Ltd |
10 |
60 |
6,000 |
6,000 |
|
Ranbaxy Labs. Ltd. |
5 |
100 |
46,004 |
46,004 |
|
Reliance Capital Ltd |
10 |
10 |
1,130 |
1,130 |
|
Reliance Communication Ltd |
5 |
200 |
33,654 |
33,654 |
|
Reliance Infrastructure |
10 |
15 |
6,348 |
6,348 |
|
Reliance Power Ltd |
10 |
74 |
7,358 |
7,358 |
|
Simplex Infrastructure Ltd |
2 |
200 |
76,982 |
76,982 |
|
SeaMac |
10 |
1000 |
1,92,315 |
1,92,315 |
|
Sesa Goa |
1 |
100 |
28,407 |
- |
|
Sonata Software Ltd |
1 |
1000 |
52,218 |
52,218 |
|
Spicejet Ltd |
10 |
250 |
15,138 |
30,276 |
|
Tamilnadu Petroproducts Ltd. |
10 |
500 |
17,290 |
17,290 |
|
Tanla Solutions Ltd |
1 |
50 |
6,625 |
6,625 |
|
Tata Tele (Mah) Services Ltd. |
10 |
700 |
20,634 |
20,634 |
|
Unitech Ltd |
2 |
200 |
44,887 |
44,887 |
|
United phosphorus |
2 |
100 |
14,083 |
- |
|
Voltamp Transformers Ltd |
10 |
100 |
63,163 |
63,163 |
|
Wipro Ltd |
2 |
83 |
13,537 |
13,537 |
|
Total Carried Over |
|
|
27,58,769 |
27,42,828 |
(Market Value of Quoted Shares Rs.33,74,323/-) |
|||||
(b) Mutual Funds & Others (Un-Quoted) |
|
|
31-3-2011 |
31-3-2010 |
|
|
Total Brought OverUTI Master Value Fund |
33.89 |
8852.169 |
27,58,769 3,00,000 |
27,42,828 3,00,000 |
|
JM Infra & Agricultural Fund |
10 |
10000 |
1,00,000 |
1,00,000 |
TOTAL : |
31,58,769 |
31,42,828 |
|||
SCHEDULE 7 : INVENTORIES
[As Taken, Valued and Certified by Management]
Raw Materials Packing Materials Finished Goods Semi Finished Goods |
|
16,04,693 9,92,728 1,62,62,248 1,68,054 |
20,06,585 10,41,238 1,33,68,881 7,50,470 |
TOTAL : |
1,90,27,723 |
1,71,67,174 |
|
SCHEDULE 8: SUNDRY DEBTORS [ Unsecured, Considered Good ]
Over Six Months Others |
13,40,585 78,91,702 |
18,16,608 99,77,867 |
TOTAL : |
92,32,287 |
1,17,94,475 |
Cash on hand |
3,90,818 88,23,135 |
7,16,417 46,21,993 |
TOTAL : |
1,17,13,953 |
65,38,410 |
SCHEDULE 10: OTHER CURRENT ASSETS
Security Deposits |
7,09,150 |
7,09,150 |
TOTAL : |
7,09,150 |
7,09,150 |
SCHEDULE 11 : LOANS AND ADVANCES
[Unsecured, Considered good]
Loans to Companies Advances Recoverable Balance with Excise Authorities Advance Tax Prepaid Expenses Vat Refund Receivable |
1,32,50,000 1,34,042 47,897 1,34,846 1,78,970 1,80,338 |
1,36,50,000 2,72,196 14,798 1,25,929 2,16,551 81,646 |
TOTAL : |
1,39,26,093 |
1,43,61,120 |
SCHEDULE 12: CURRENT LIABILITIES AND PROVISIONS |
31-3-2011 |
31-3-2010 |
Sundry Creditors: |
66,30,085 |
43,90,891 |
TOTAL : |
96,67,165 |
64,99,134 |
SCHEDULES FORMING PART OF THE PROFIT & LOSS ACCOUNT
SCHEDULE 13 : OTHER INCOME |
2010-2011 |
2009-2010 |
||
Interest received [Includes T. D. S of Rs.15281/-] Sales Tax Refund |
93,512 - |
1,05,490 51,090 |
||
TOTAL : |
2,21,982 |
1,97,031 |
||
SCHEDULE 14 : COST OF MATERIALS
CONSUMPTION OF RAW MATERIALS : |
|
|
|
Opening Stock |
20,06,585 |
|
23,40,116 |
Add : Purchases |
1,18,90,816 |
|
99,82,416 |
TOTAL |
1,38,97,401 |
|
1,23,22,532 |
Less : Closing Stock |
16,04,693 |
|
20,06,585 |
Consumption |
|
1,22,92,708 |
1,03,15,947 |
CONSUMPTION OF PACKING MATERIALS : |
|
|
|
Opening Stock |
10,41,238 |
|
9,68,102 |
Add : Purchases |
86,92,452 |
|
76,93,506 |
TOTAL |
97,33,690 |
|
86,61,608 |
Less : Closing Stock |
9,92,728 |
|
10,41,238 |
Consumption |
|
87,40,962 |
76,20,370 |
|
|
|
|
PURCHASE OF FINISHED GOODS : |
|
30,45,463 |
24,73,755 |
|
|||
[INCREASE] / DECREASE IN FINISHED GOODS & WORK IN PROCESS : |
|
|
|
OPENING STOCK : Finished Goods |
1,33,68,881 |
|
1,41,07,584 |
Work in Process |
7,50,470 |
|
4,01,082 |
TOTAL |
1,41,19,351 |
|
1,45,08,666 |
CLOSING STOCK : Finished Goods |
1,62,62,247 |
|
1,33,68,881 |
Work in Process |
1,68,054 |
|
7,50,470 |
TOTAL |
1,64,30,301 |
|
1,41,19,351 |
[Increase] / Decrease |
|
( 23,10,950 ) |
3,89,315 |
TOTAL : |
2,17,68,183 |
2,07,99,387 |
|
SCHEDULE 15 : OTHER MANUFACTURING EXPENSES |
2010-2011 |
2009-2010 |
Wages & Salaries................................................................... |
23,95,749 |
21,75,350 |
Power & Fuel......................................................................... |
6,90,907 |
6,11,130 |
Freight Inward........................................................................ |
1,30,125 |
1,41,603 |
Blocks & Designs.................................................................... |
20,250 |
64,550 |
Laboratory Expenses.............................................................. |
1,08,400 |
1,16,748 |
Analytical Charges.................................................................. |
2,23,745 |
2,13,624 |
A. C. Rental Charges. ............................................................ |
1,32,778 |
1,29,506 |
Loan License Charges Paid. ................................................... |
13,49,788 |
12,32,889 |
Consumable Stores................................................................ |
2,35,256 |
1,54,937 |
Water Charges. ..................................................................... |
20,365 |
20,551 |
Factory Security Charges........................................................ |
1,41,944 |
1,21,790 |
Rent Paid…………................................................................. |
1,80,000 |
1,14,000 |
Insurance............................................................................... |
90,071 |
1,47,802 |
Factory Transportation............................................................ |
2,80,616 |
2,25,795 |
Excise Duty............................................................................ |
33,12,887 |
27,13,220 |
Repairs & Maintenance : Plant & Machinery Rs. 76,416 |
|
|
Building Rs. -- |
|
|
Others Rs. 1,02,833 |
1,79,249 |
1,59,309 |
TOTAL : |
94,92,130 |
83,42,804 |
SCHEDULE 16 : ADMINISTRATION & OTHER EXPENSES
|
2010-2011 |
2009-2010 |
Travelling Expenses.............................................................. |
12,18,260 |
9,71,784 |
Printing & Stationery............................................................. |
43,813 |
58,457 |
Society Maintenance Charges................................................ |
79,339 |
64,051 |
Taxes, License & Fees.......................................................... |
3,67,538 |
2,38,715 |
Office Expenses.................................................................... |
5,87,384 |
4,90,012 |
Conveyance.......................................................................... |
2,42,506 |
2,06,410 |
Legal & Professional Charges.....................................…......... |
5,99,037 |
6,73,026 |
Employer’s Contribution to Provident Fund....................……..... |
6,19,457 |
6,13,753 |
Administration Salary.............................................................. |
11,56,432 |
12,03,519 |
Postage &Telegrams………………...................................…... |
2,63,182 |
2,41,560 |
Telephones……………………………………………….………… |
2,63,352 |
2,22,532 |
Books, Periodicals & Subscription. .....................................… |
19,100 |
28,000 |
Auditor’s Remuneration.......................................................... |
85,096 |
72,000 |
Managerial Remuneration...................................................... |
15,49,000 |
13,87,000 |
Bonus ………………………………………………..…………….. |
86,399 |
92,356 |
Gratuity................................................. |
40,800 |
95,000 |
Annual General Meeting Expenses......................................... |
21,945 |
24,630 |
TOTAL : |
72,42,640 |
66,82,805 |
SCHEDULE 17 : SELLING & DISTRIBUTION EXPENSES
2010-2011 |
2009-2010 |
|
Salary................................................................................. |
72,30,686 |
67,36,365 |
Incentives & Bonus............................................................. |
20,15,681 |
15,14,294 |
Freight & Forwarding .......................................................... |
12,66,100 |
11,93,718 |
Recruitment & Statutory Advertisement................................ |
2,04,648 |
51,083 |
C & F Charges & Commission………………………………… |
9,12,993 |
9,27,890 |
Field Staff Travelling……..................................................... |
55,02,486 |
53,48,657 |
TOTAL : |
1,71,32,594 |
1,57,72,007 |
SCHEDULE 18: NOTES ON ACCOUNTS:-
a) Significant Accounting Policies:
i] General :
The Financial statements are prepared under historical cost convention on an accrual basis and comply with the accounting standards referred to in Section 211 ( 3C ) of the Companies Act, 1956.
ii] Fixed Assets:
Fixed assets are stated at original cost net of tax / duty credits availed, if any.
iii] Capital work in progress:
The capital work in progress as on 31-03-2011 is Rs. Nil
iv] Depreciation :
Fixed Assets are depreciated under Straight Line Method. The applicable rates are as provided under Schedule XIV to the Companies Act, 1956. Depreciation on additions / deletions of assets during the year is provided on a pro-rata basis.
v] Inventories:
Raw materials and packing materials are valued at cost on FIFO basis as per revised Accounting Standard AS-2 of the Institute of Chartered Accountants of India. Finished goods and semi-finished goods are valued at lower of cost or net realizable value.
vi] Investments:
Investments are stated at cost.
vii] Sales:
Sales are recognized at the time of dispatch of goods. All sales are shown inclusive of excise duty and exclusive of Sales Tax (VAT).
viii] Other income:
Includes interest on Fixed Deposits with Bank, dividends received and capital gains on the shares sold.
ix] Research and Development Expenses:
No capitalization of Research and Development expenses is made since no capital expenditure on research and development expenditure has been incurred during the year.
x] Foreign Currency Transactions:
Export earnings of Rs.Nil (Previous Year - Rs.NIL)
Foreign Exchange Outgo of Rs.NIL (Previous Year – Rs. NIL /-)
xi] Retirement Benefits:
Retirement benefit in respect of gratuity is not provided for, and liability is not
ascertained.
Privilege leave entitlement: Privilege leave entitlements are recognized as a liability as and when the same is encashed by the employees.
Provident Fund: Contribution to Government provident Fund are made as per the provisions regularly.
b) The figures of previous year have been regrouped wherever necessary.
c) As per the available records, there is no outstanding dues to enterprises registered under Micro, Small and Medium Enterprises Development Act, 2006, at the end of the year. Further, no interest has been paid or payable on delayed payment of dues, if any, to such enterprises during the year
d) Estimated amount of contracts remaining to be executed on capital account and not provided for: Rs.Nil [ Previous Year : Rs. Nil ]
e) Contingent Liabilities:
Bills Discounted and Purchased - Rs. Nil (Previous Year Rs. Nil )
Others - Rs. Nil (Previous Year Rs. Nil )
f) Auditors Remuneration :
| 2010-2011 | 2009-2010 | |
| Audit Fees | Rs. 55,150 |
Rs. 50,000 |
Tax Audit Fees |
Rs. 11,030 |
Rs. 10,000 |
Other services |
Rs. 18,916 |
Rs. 12,000 |
Total |
Rs. 85,096 |
Rs. 72,000 |
g) Directors Remuneration:
The company has been advised that the computation of net profit for the purpose of Directors’ remuneration under Section 349 of the Companies Act, 1956 need not be enumerated since no commission has been paid to Directors. Fixed monthly remuneration has been paid to the Directors as per Schedule XIII to the Companies Act, 1956.
| Remuneration includes; | 2010-2011 | 2009-2010 |
| a) Salary | Rs. 14,29,000 |
Rs. 12,67,000 |
Other Perks |
NIL |
NIL |
|
Rs. 14,29,000 |
Rs. 12,67,000 |
Sitting fees paid to Non-Executive Independent Directors |
Rs. 1,20,000 |
Rs. 1,20,000 |
h) Segment Reporting
The Company is engaged in pharmaceutical formulation business which as per Accounting Standard – AS 17 is considered the only reportable business segment.
i) Related party transaction
As required by Accounting Standard – AS 18 ‘Related Parties Disclosure’ issued by the Institute of Chartered Accountants of India are as follows :
(a) Key Management personnel (b) Details of Transactions.
(i) Dr. L. S. Mani. Remuneration paid Rs.7,59,500/-
Rent paid for the premise hired Rs. 1,80,000/-
j) Earning per share
As per Accounting Standard – AS 20 on ‘Earning per Share’ issued by the Institute of Chartered Accountants of India, the earning per share of the Company is Rs. 0.16.
k) Accounting for Taxes on Income.
In accordance with the AS-22, Accounting for Taxes on Income, issued by the Institute of Chartered Accountants of India, deferred tax resulting from timing differences between book and tax profits is accounted for, at the current rate of tax, to the extent the timing differences are expected to crystallize. The deferred tax asset arising on account of brought forward unabsorbed depreciation is recognized only to the extent there is a reasonable certainty of realization.
l) AS – 28 Impairment of Assets.
As on the Balance Sheet date the carrying amounts of the assets net of accumulated depreciation is not less than the recoverable amount of those assets. Hence there is no impairment loss on the assets of the company.
In the opinion of Board of Directors, the Current Assets, Loans and advances have a value which on the realization in the ordinary course of business would at least be equal amount stated in the Balance sheet.
m) With regard to loan given to Company, the Board of Directors are of the opinion that no interest should be provided in the accounts as the principle amount has not been recovered, Further, no provision for doubtful debt is required to be made as the amount is expected to be recovered in due course.
n) Deferred Tax :
The break up of the deferred tax liability as at 31st March, 2011 is as under:
|
2010-11 |
2009-10 |
Deferred Tax Liability : |
|
|
Difference between book depreciation and |
64,30,675 |
63,70,119 |
|
64,30,675 |
63,70,119 |
Deferred Tax Assets: |
29,46,695 |
28,08,204 |
Net Deferred Tax Liability |
34,83,980 |
35,61,915 |
o) The Share Capital includes 4,00,000 Equity Shares of Rs. 10/- each, allotted as fully paid Bonus Shares by capitalisation of Capital Reserves in 1994-95.
p) Additional information pursuant to the provisions of paragraph 3, 4C and 4D of Part II of Schedule VI to the Companies Act, 1956, as certified by the Directors.
Quantitative and Turnover information for the year ending 31st March, 2011.(Previous year figures are regrouped wherever necessary)
i] Manufacturing Activities :
Class |
Units |
Installed Capacity | Actual production |
Purchases |
Sales |
Closing Stock |
|||
| Tablets | Nos. | 600 | 137.800 | 26.500 | 52.41 | 37.990 | 50.27 | 126.31 | 179.10 |
| in Lacs. | ( 600) | (119.800) | (22.730) | (34.70) | (26.500) | (52.41) | (115.51) | (156.00) | |
| Capsules | Nos. | 400 | 99.870 | 12.030 | 35.74 | 22.790 | 60.56 | 89.11 | 252.59 |
| in Lacs. | ( 400) | (88.160) | (14.060) | (44.20) | (12.030) | (35.74) | (90.19) | (241.03) | |
| Liquids | Ltrs. | - | 19051.160 | 5384.400 | 12.12 | 5605.770 | 16.88 | 18829.79 | 58.53 |
| in Lacs. | - | (18735.260) | (3964.11) | (9.24) | (5384.400) | (12.12) | (17314.97) | (40.48) | |
| Ointments | Kgs. | 3739.535 | 816.025 | 14.68 | 1256.330 | 17.88 | 3299.23 | 49.59 | |
| Liquids | in Lacs. | (3776.225) | (1421.175) | (18.10) | (816.025) | (14.68) | (4381.41) | (49.08)) | |
Notes :
ii] Particulars of Goods Traded: [Rupees in Lacs]
Class |
Units |
Opening Stock |
Purchases |
Sales |
Closing Stock |
||||
| Liquids | Ltrs. | 979.200 | 2.53 | 4124.200 | 7.67 | 4620.200 | 14.32 | 483.200 | 1.24 |
| (1729.800) | (4.47) | (4826) | (8.44) | (5576.600) | (16.41) | (979.200) | (2.53) | ||
| Injectables | Ltrs. | 13.860 | 2.87 | 134.606 | 6.74 | 77.820 | 10.98 | 70.646 | 7.45 |
| (78.73) | (16.36) | (54.24) | (1.78) | (119.110) | (21.31) | (13.860) | (2.87) | ||
| Capsules | Nos. | 0.530 | 1.73 | 8.580 | 16.04 | 7.360 | 30.60 | 1.750 | 5.69 |
| in Lacs. | (2.376) | (7.76) | (6.044) | (11.43) | (7.89) | (31.70) | (0.53) | (1.73) | |
| Tablets | Nos. | 3.880 | 11.61 | - | - | 2.880 | 7.65 | 1.000 | 2.65 |
| in Lacs. | (2.087) | (6.25) | (4.769) | (3.09) | (2.976) | (7.98) | (3.88) | (11.61) | |
iii] The quantity and value of consumption of raw materials
Raw Materials (Bulk Drugs) |
Quantity (Kgs.) |
Value (Rupees in Lacs) |
|||
1 |
Calcium Pantothenate |
462 |
475 |
3.04 |
3.09 |
2 |
Vitamin E |
368 |
350 |
8.81 |
5.12 |
3 |
Meclizine |
180 |
140 |
13.58 |
11.26 |
4 |
Paracetamol |
2450 |
2000 |
6.61 |
5.07 |
5 |
Chlorazoxazone |
300 |
225 |
1.64 |
1.25 |
6 |
Isox suprine Hcl |
17 |
17 |
2.15 |
2.05 |
7 |
Riboflavin |
75 |
71 |
3.74 |
3.58 |
8 |
Niacinamide |
430 |
408 |
3.45 |
2.65 |
9 |
Thiaminemono |
80 |
77 |
1.67 |
1.02 |
10 |
Spirulina |
2829 |
2981 |
13.77 |
13.27 |
11 |
Clindamycin Phosphate |
5 |
13 |
1.09 |
1.16 |
12 |
Progesterone |
125 |
50 |
18.10 |
7.53 |
13 |
Menthol |
170 |
166 |
1.97 |
1.57 |
14 |
Propylene Glycol |
1590 |
1288 |
2.54 |
1.88 |
15 |
Sorbitol |
600 |
2501 |
0.24 |
0.84 |
16 |
Fish Oil |
160 |
360 |
1.42 |
3.50 |
17 |
Cod Liver Oil |
- |
180 |
- |
1.16 |
18 |
Sugar |
7500 |
11600 |
2.17 |
3.31 |
19 |
Atorvastatin calcium |
- |
7 |
- |
1.21 |
20 |
Ezetimibe |
- |
3 |
- |
1.52 |
21 |
Ofloxacin usp |
95 |
250 |
1.88 |
2.04 |
22 |
Quinine Sulphate |
30 |
25 |
2.03 |
1.43 |
23 |
Mat SR Base III |
106 |
61 |
1.76 |
1.06 |
24 |
Ornidazole |
237 |
250 |
2.26 |
2.04 |
25 |
Empty Gelatin Capsule |
|
-- |
10.39 |
10.34 |
26 |
Others |
|
|
18.62 |
14.20 |
|
Total : |
|
|
122.93 |
103.15 |
Statement Pursuant to Part IV of Schedule VI to the Companies Act, 1956. Balance Sheet abstract and Company’s General Business Profile
| I. | Registration Details | ||
| State Code: 1 1 | Registration No. 41128 | ||
| Balance Sheet Date | 31 - 03 - 2011 | ||
| II. | Capital Raised during the year ( Amounts in Rs. Thousands ) | ||
| Public Issue | Right Issue | ||
| N I L | N I L | ||
| Bonus Issue | Private Placement | ||
| N I L | N I L | ||
| III. | Position of Mobilization and Deployment of Funds : ( Amounts in Rs. Thousands ) | ||
| Total Liabilities | Total Assets | ||
| 9 2 2 3 2 | 9 2 2 3 2 | ||
| Sources of Funds : Paid-Up Capital | Reserves and Surplus | ||
| 3 5 4 3 5 | 2 4 8 4 6 | ||
| Secured Loans | Un secured Loans | ||
| 1 3 0 8 4 | 1 5 3 8 3 | ||
| Deferred Tax Liability | |||
| 3 4 8 4 | |||
| Application of Funds: | |||
| Net Fixed Assets | Investments | ||
| 4 4 1 3 1 | 3 1 5 9 | ||
| Net Current Assets | Misc. Expenditure | ||
| 4 4 9 4 2 | N I L | ||
| Accumulated Loss | |||
| N I L | |||
| IV. | Performance of Company : ( Amounts in Rs. Thousands ) | ||
| Turnover | Total Expenditure | ||
| 6 0 5 5 9 | 5 9 7 7 4 | ||
| + - Profit/ Loss Before Tax | + - Profit/Loss After Tax | ||
| + 7 8 5 | + 7 2 9 | ||
| ( Please tick Appropriate box + for Profit, - for Loss ) | |||
| Earning per Share | Dividend Rate | ||
| 0 . 1 6 | - - | ||
| V. | Generic Names of Three Principal Products / Services of Company (As per Monetary terms) | ||
| Item Code No. ( ITC Code) | 2 9 3 6 2 4 0 0 | ||
| Product Description | Calcium D Pantothenate | ||
| Item Code No. (ITC Code) | 3 0 0 4 9 0 3 6 | ||
| Product Description | Other Anti-histamines | ||
| Item Code No. ( ITC Code) | 3 0 0 4 9 0 6 9 | ||
| Product Description | Analgesic, Antiinflammatory | ||
| As per our report of even date attached. | ||
| FOR S. V. BHAT & CO. | FOR AND ON BEHALF OF THE BOARD. | |
| Chartered Accountants. | ||
| S. V. BHAT | Dr. L. S. Mani | Chairman & Managing Director |
| Proprietor. | N. K. MENON | Director |
| M. No. 37237 . | ||
| FIRM REG.NO.101298W | ||
| Mumbai | ||
| Date:17th May, 2011. | ||
| Contact: |
| A/101, Pratik Estate, |
| Mulund Link Road, |
| Next to Fortis Hospital, |
| Mumbai-400078. |
| Tel.: 91-22-25668002/3 |
| Fax: 91-22-25668006. |
| Email: cllfindoc@yahoo.com |
| Website:www.findoc-cll.in |
| Email:info@findoc-cll.in |